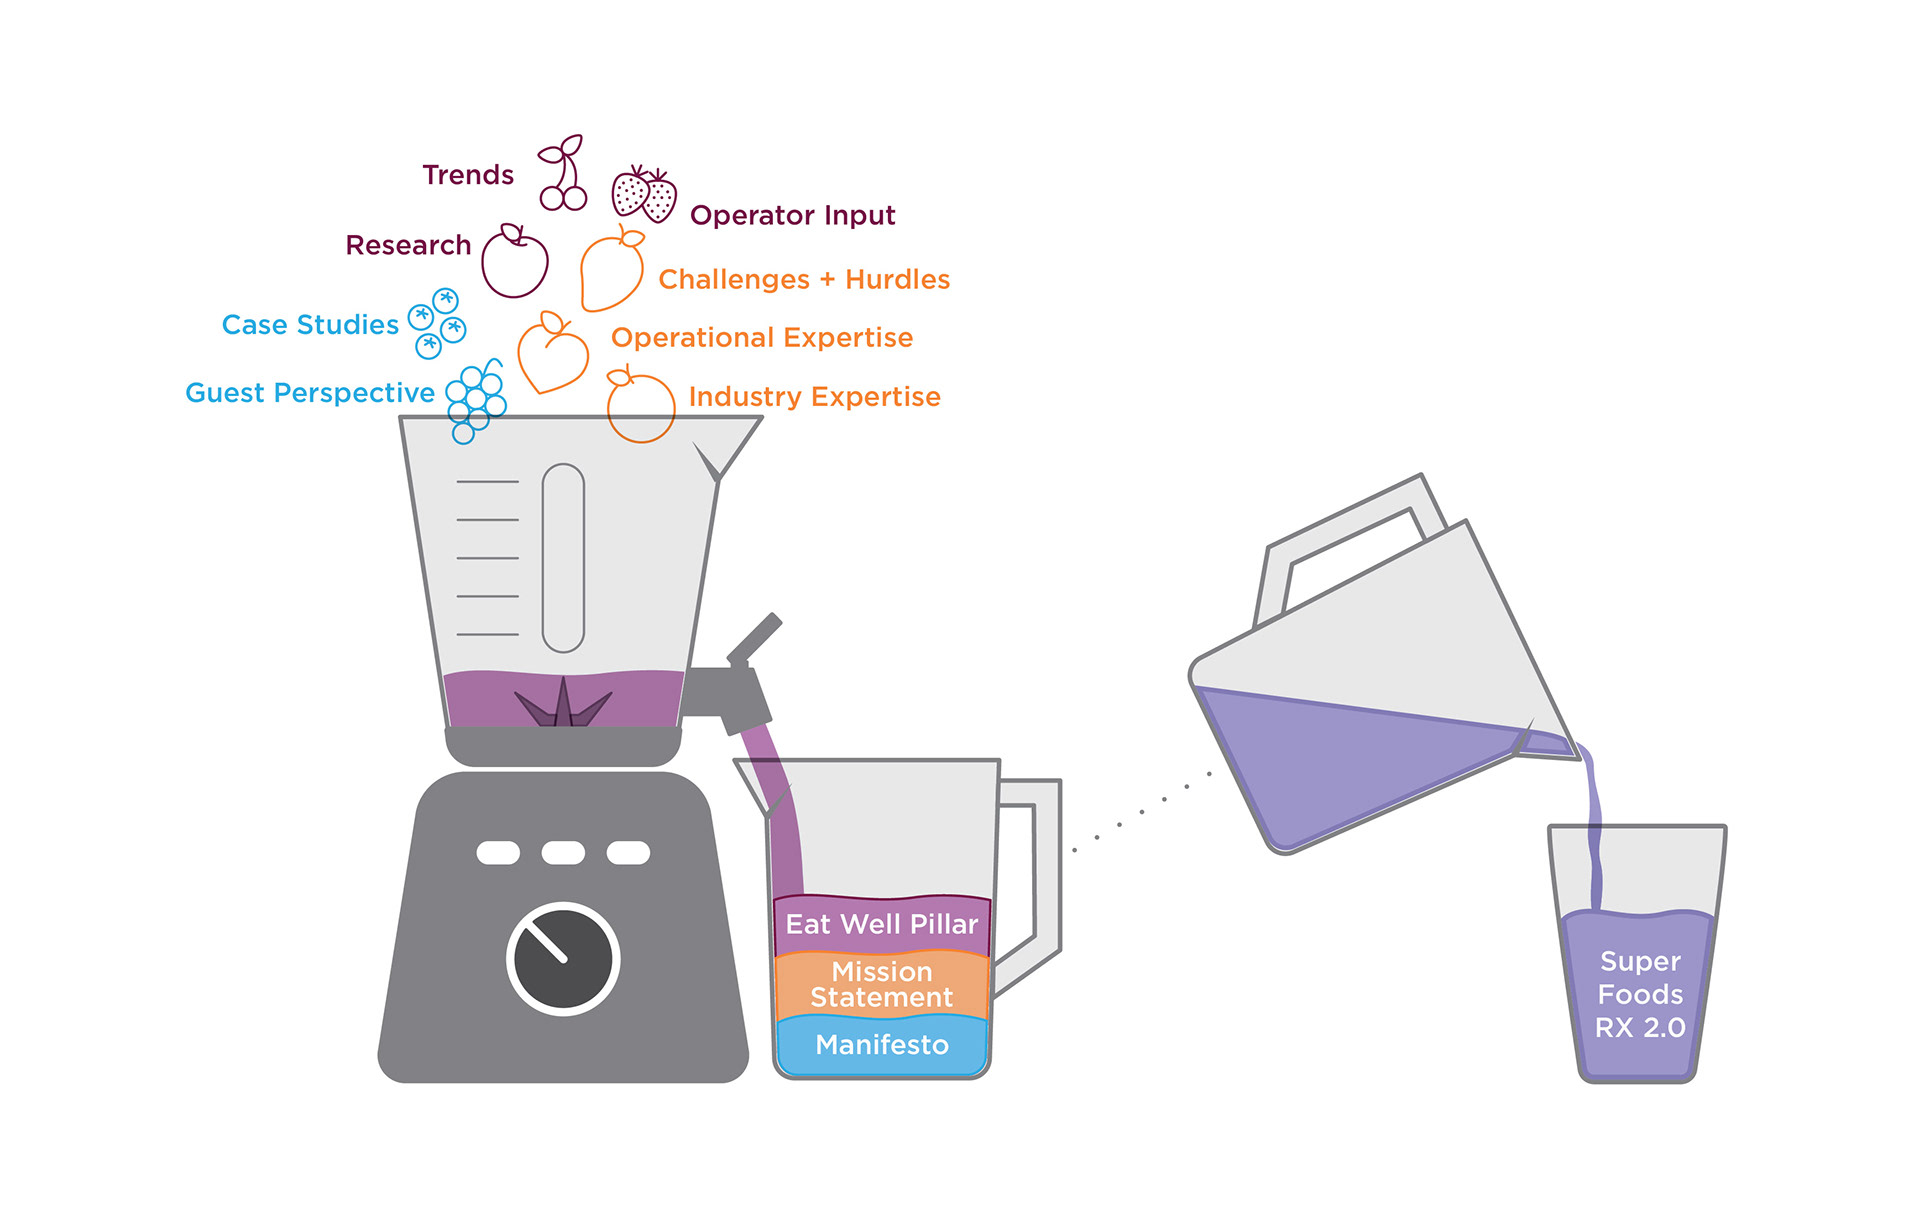
Juicer Graphic
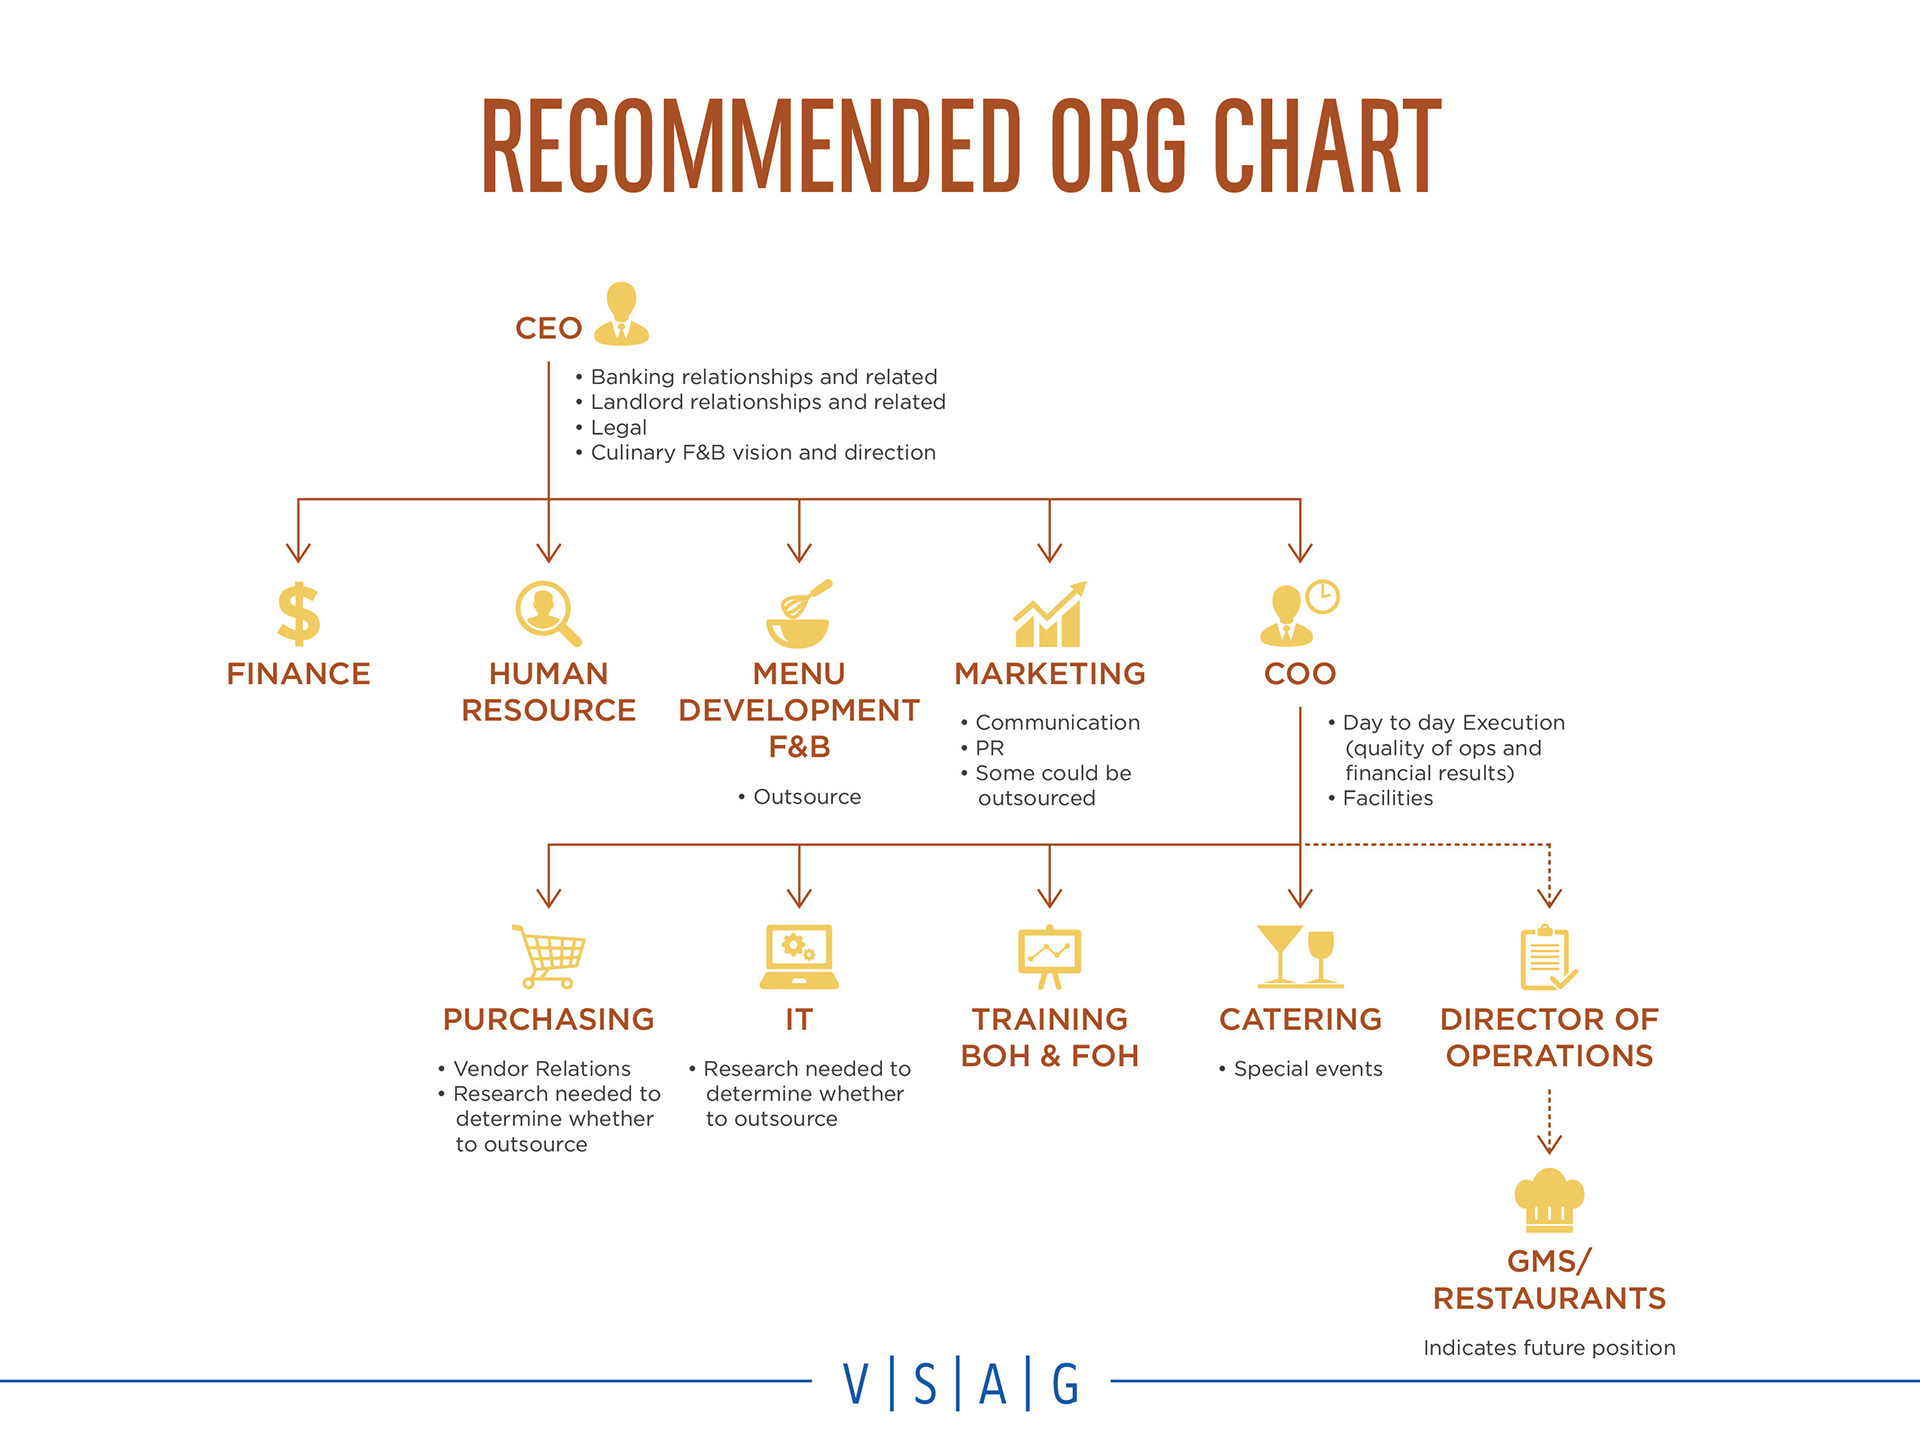
Recommended Org Chart
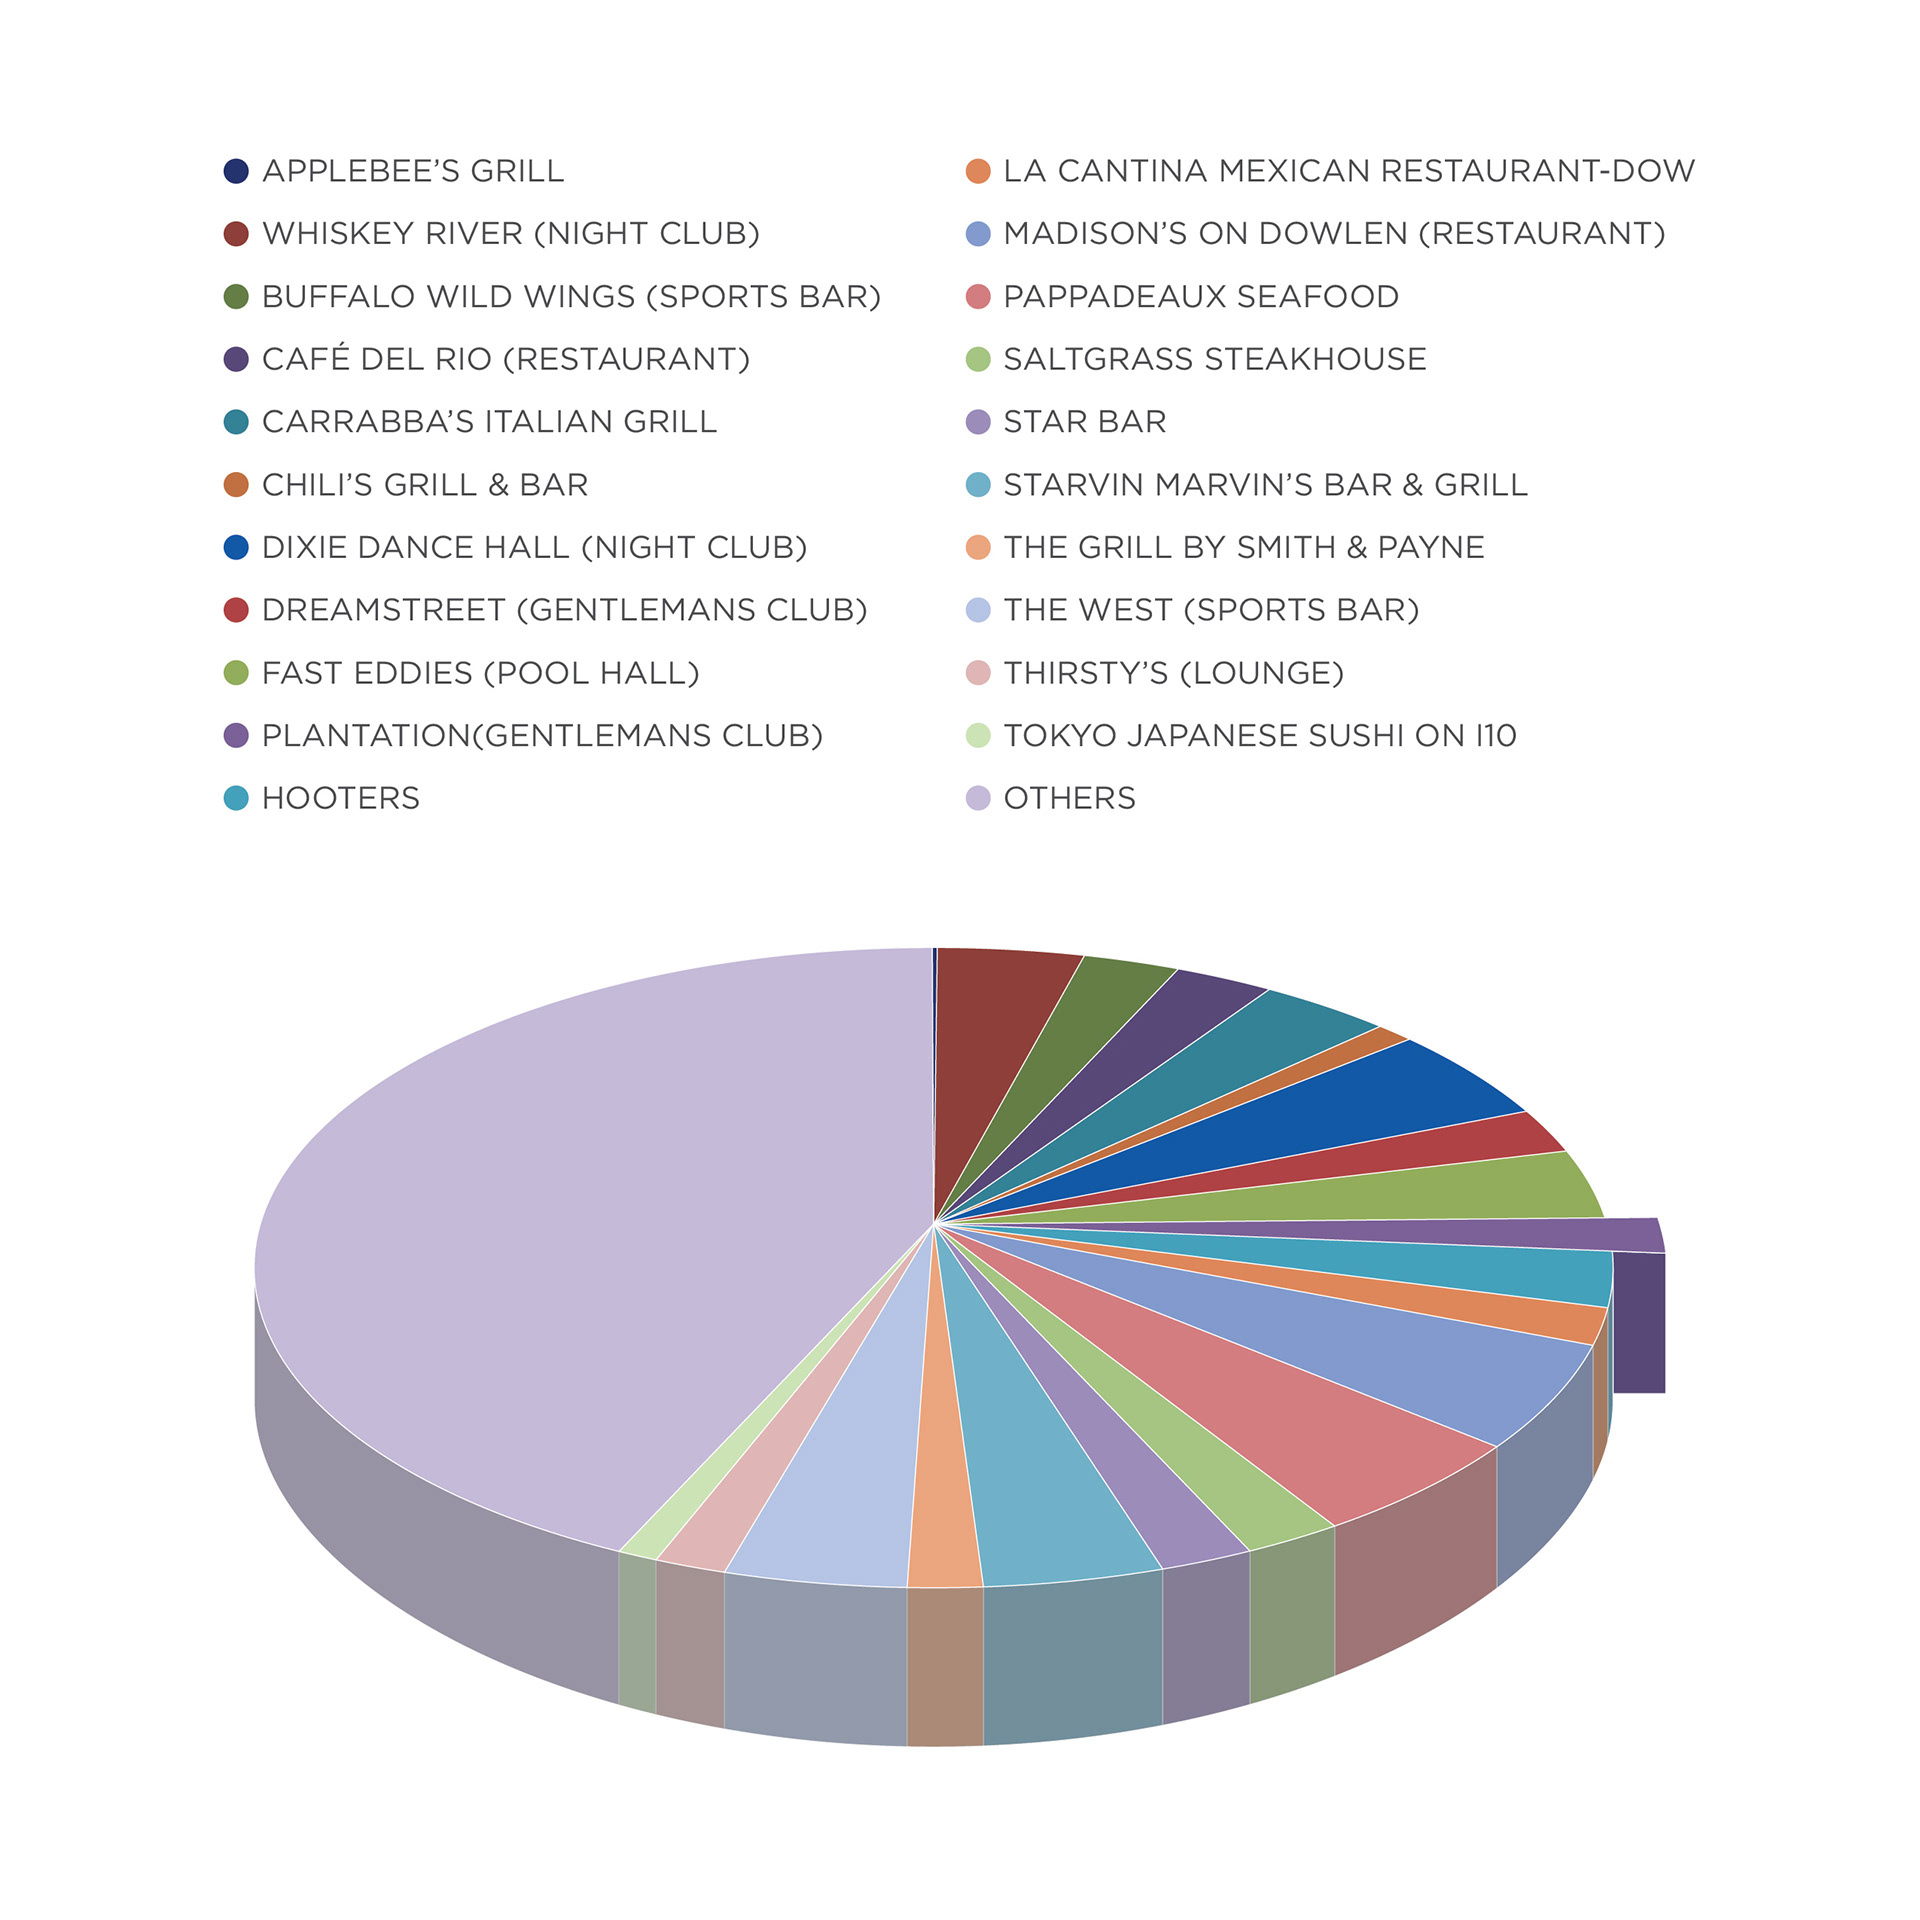
Top 20 TABC Sales Pie Chart
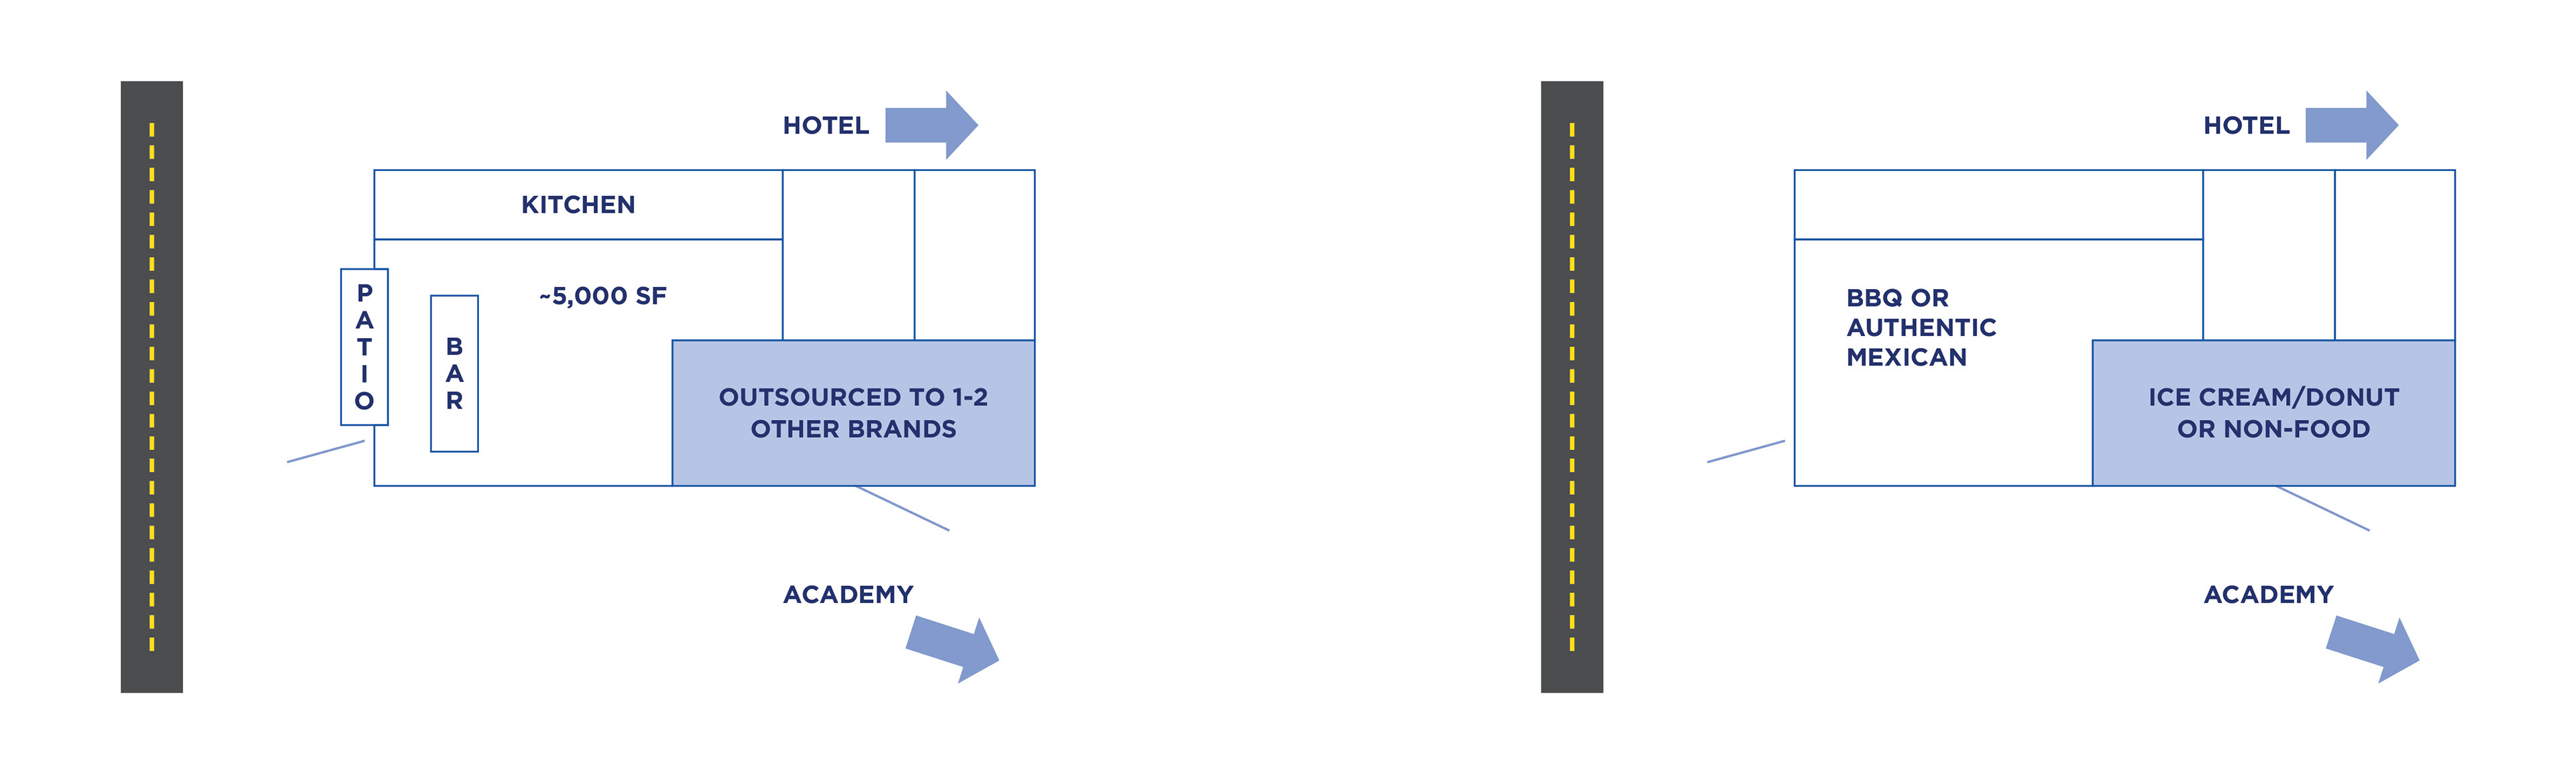
Floor Plan Recommendations

Conceptual Business Cycle
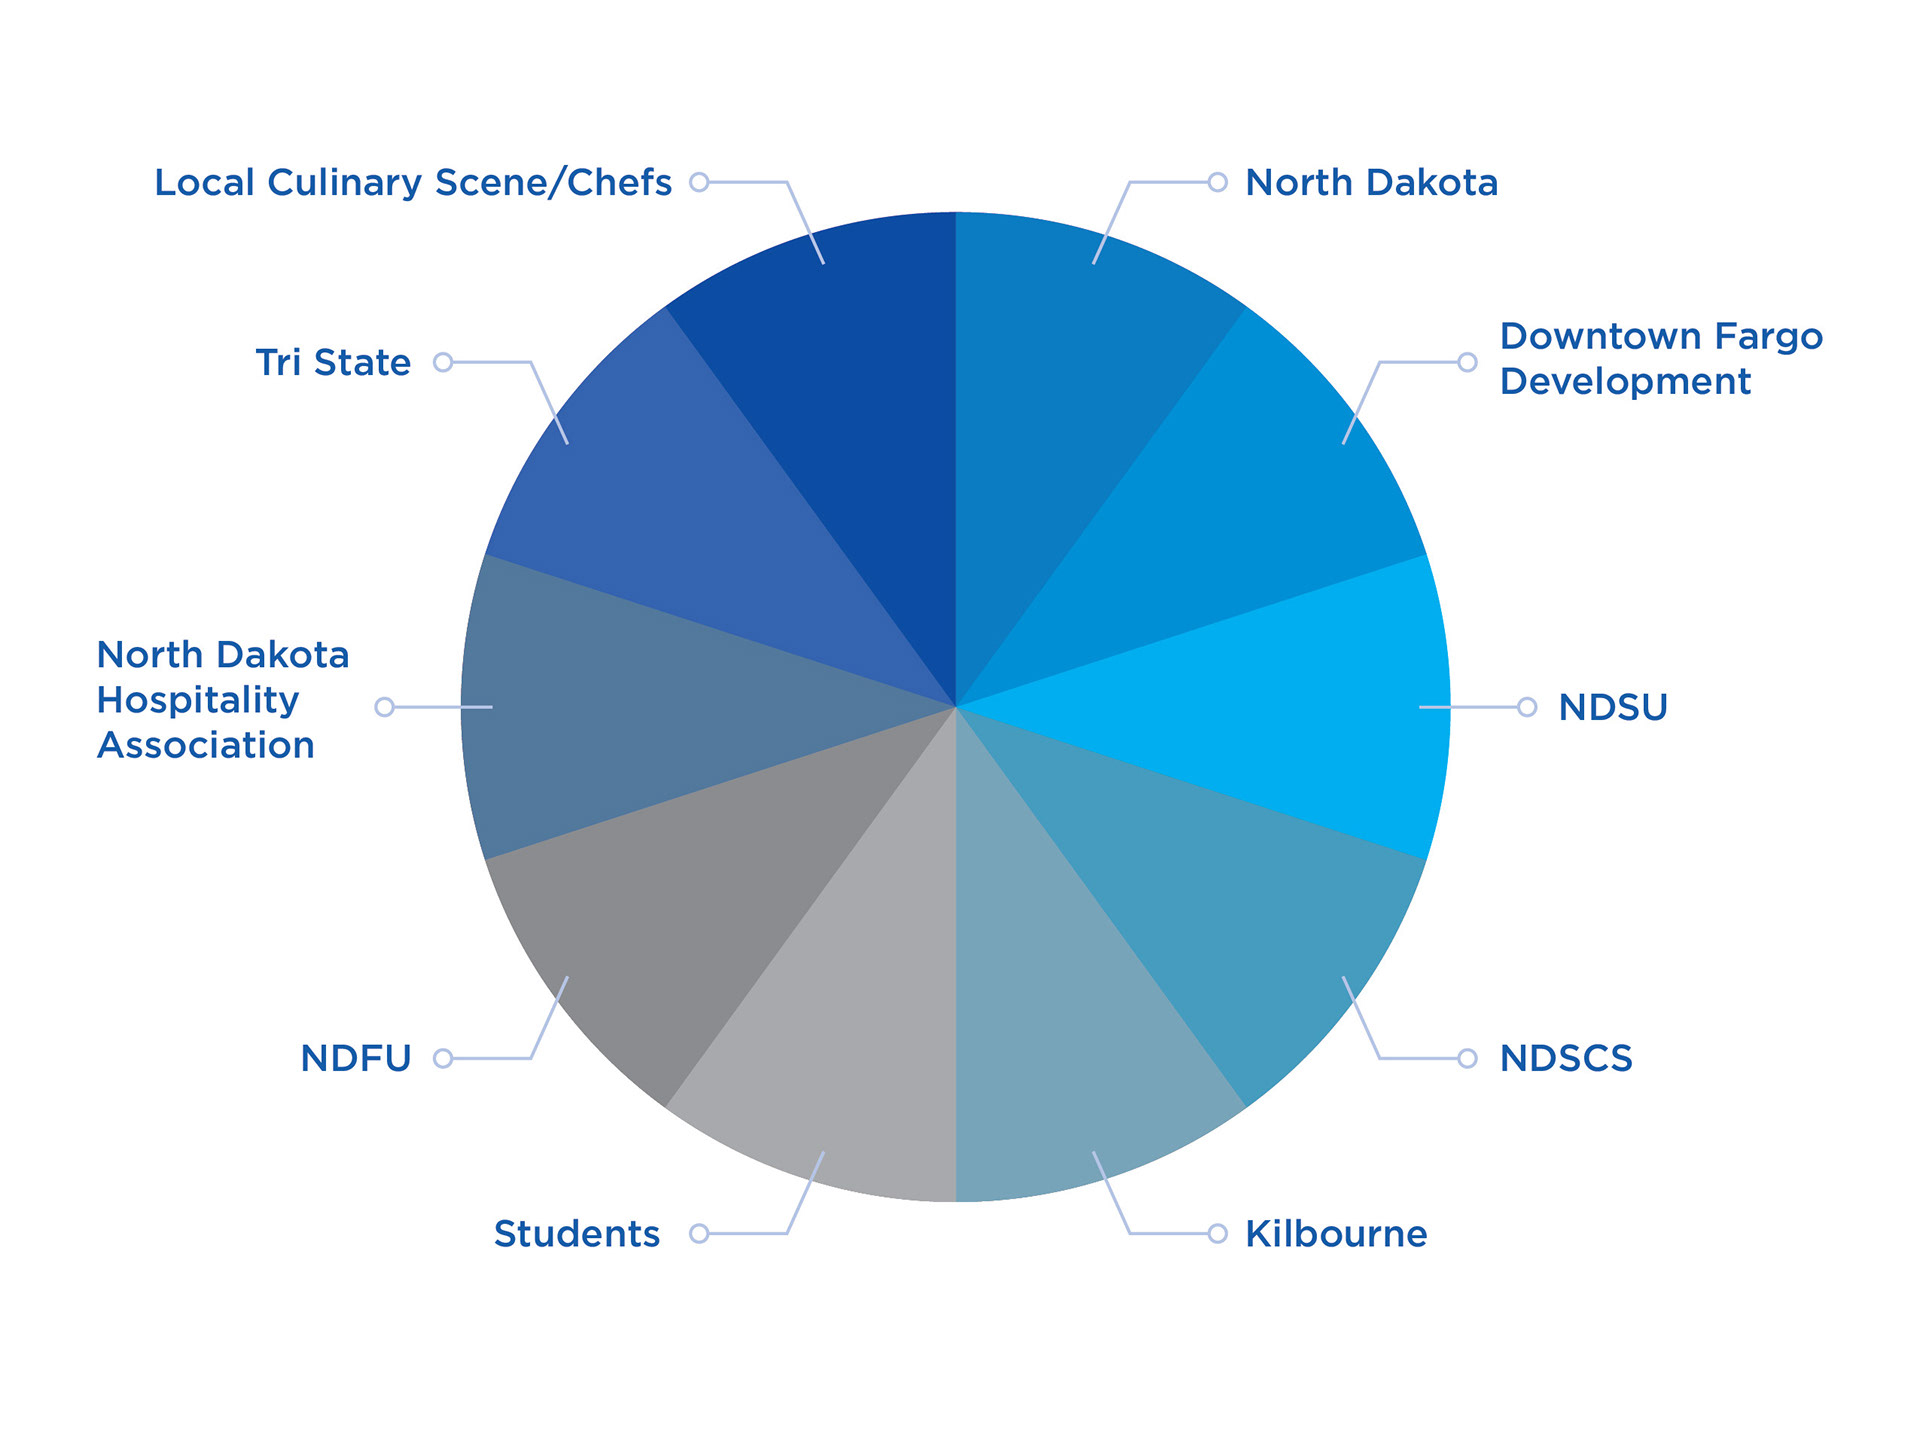
Stakeholder Pie Chart


These are a sample of infographics that I created for Vucurevich Simons Advisory Group (VSAG) while working with Seth Design Group. The infographics were used in various reports and power points for VSAG and followed their established typography and color schemes.